Infographic Illustration on Soil Carbon & Hydrology Research
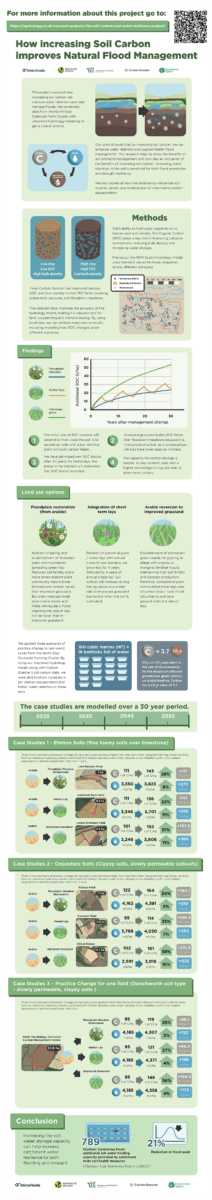
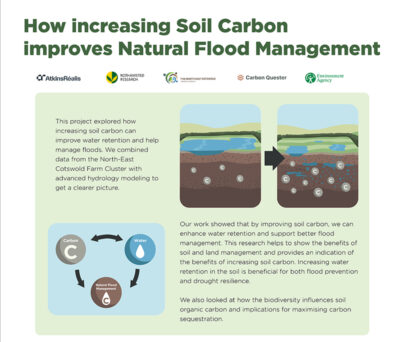
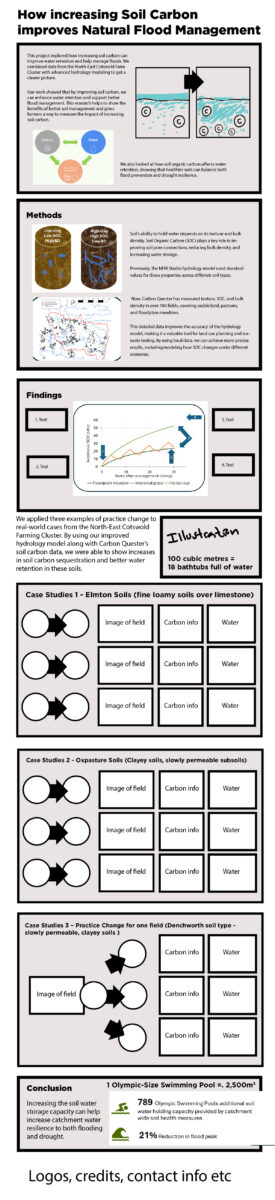
Carbon Sequester commissioned this illustrated infographic that communicates the aims, methods, and key findings of a research project integrating soil carbon data with hydrology modelling. The infographic translates complex environmental research into a clear, visually engaging format suitable for both technical and non-specialist audiences.
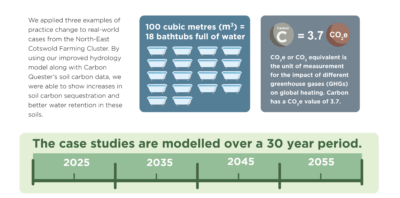
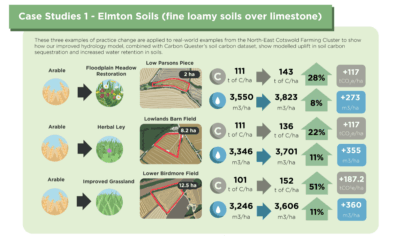
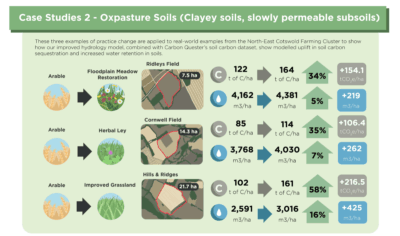
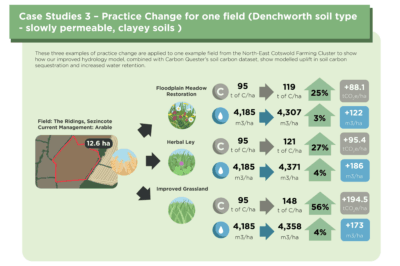
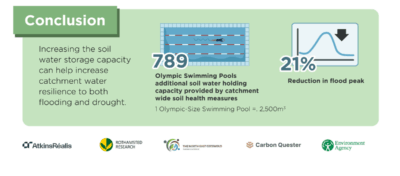
The visual content highlights the project’s nine case studies, explaining how data from soil carbon and water modelling can be used to support sustainable land management and investment decisions. The client provided a PowerPoint presentation which the information was extracted from for the infographic design.

Target Audience
-
Primary: Natural and ecological resource managers, natural capital investors, and environmental researchers.
-
Secondary: Farmers and landowners interested in understanding the project’s real-world implications.
Deliverables
-
Main Infographic showcasing project overview, methodology, and case studies.
-
Standalone Infographic sections extracted from the main design for website and presentation use.
-
File formats supplied: PDF, SVG, PNG, and JPEG at high resolution, suitable for web and presentation use.
Production Process
The project followed a structured, collaborative design process with multiple review points to refine content and visual presentation:
-
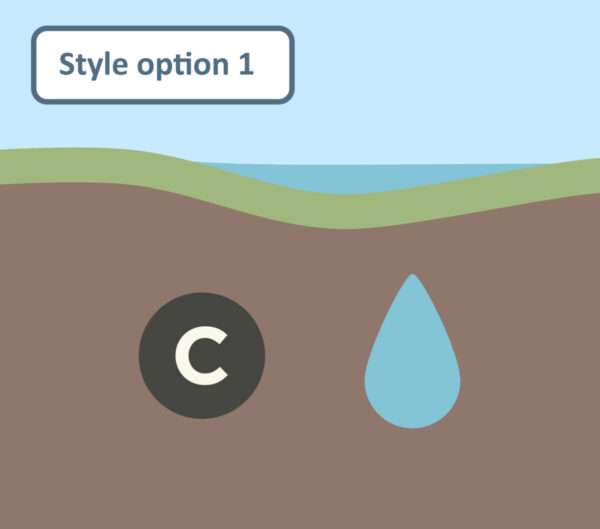
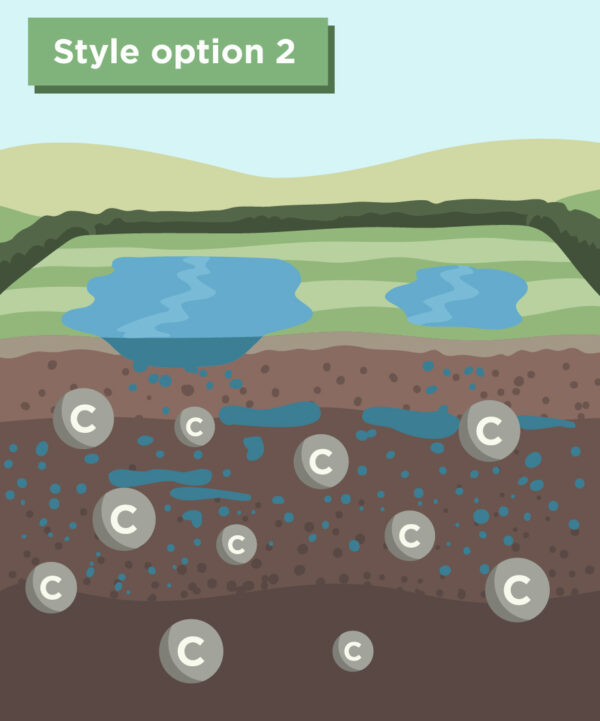
Stage 1: Sketch layouts, icon ideas, and style example.
-
Stage 2: Full illustration with colour and visual styling.
-
Stage 3: Final artwork preparation and delivery.
Each stage included two rounds of feedback to ensure the final design met all communication goals and visual standards.
The final infographic successfully presents complex scientific concepts in a clear, accessible, and visually engaging way, helping bridge the gap between research and real-world application for environmental professionals, investors, and land managers.
Stage 1: Style concepts
Stage 1: Draft infographic
Stage 3: Final infographic